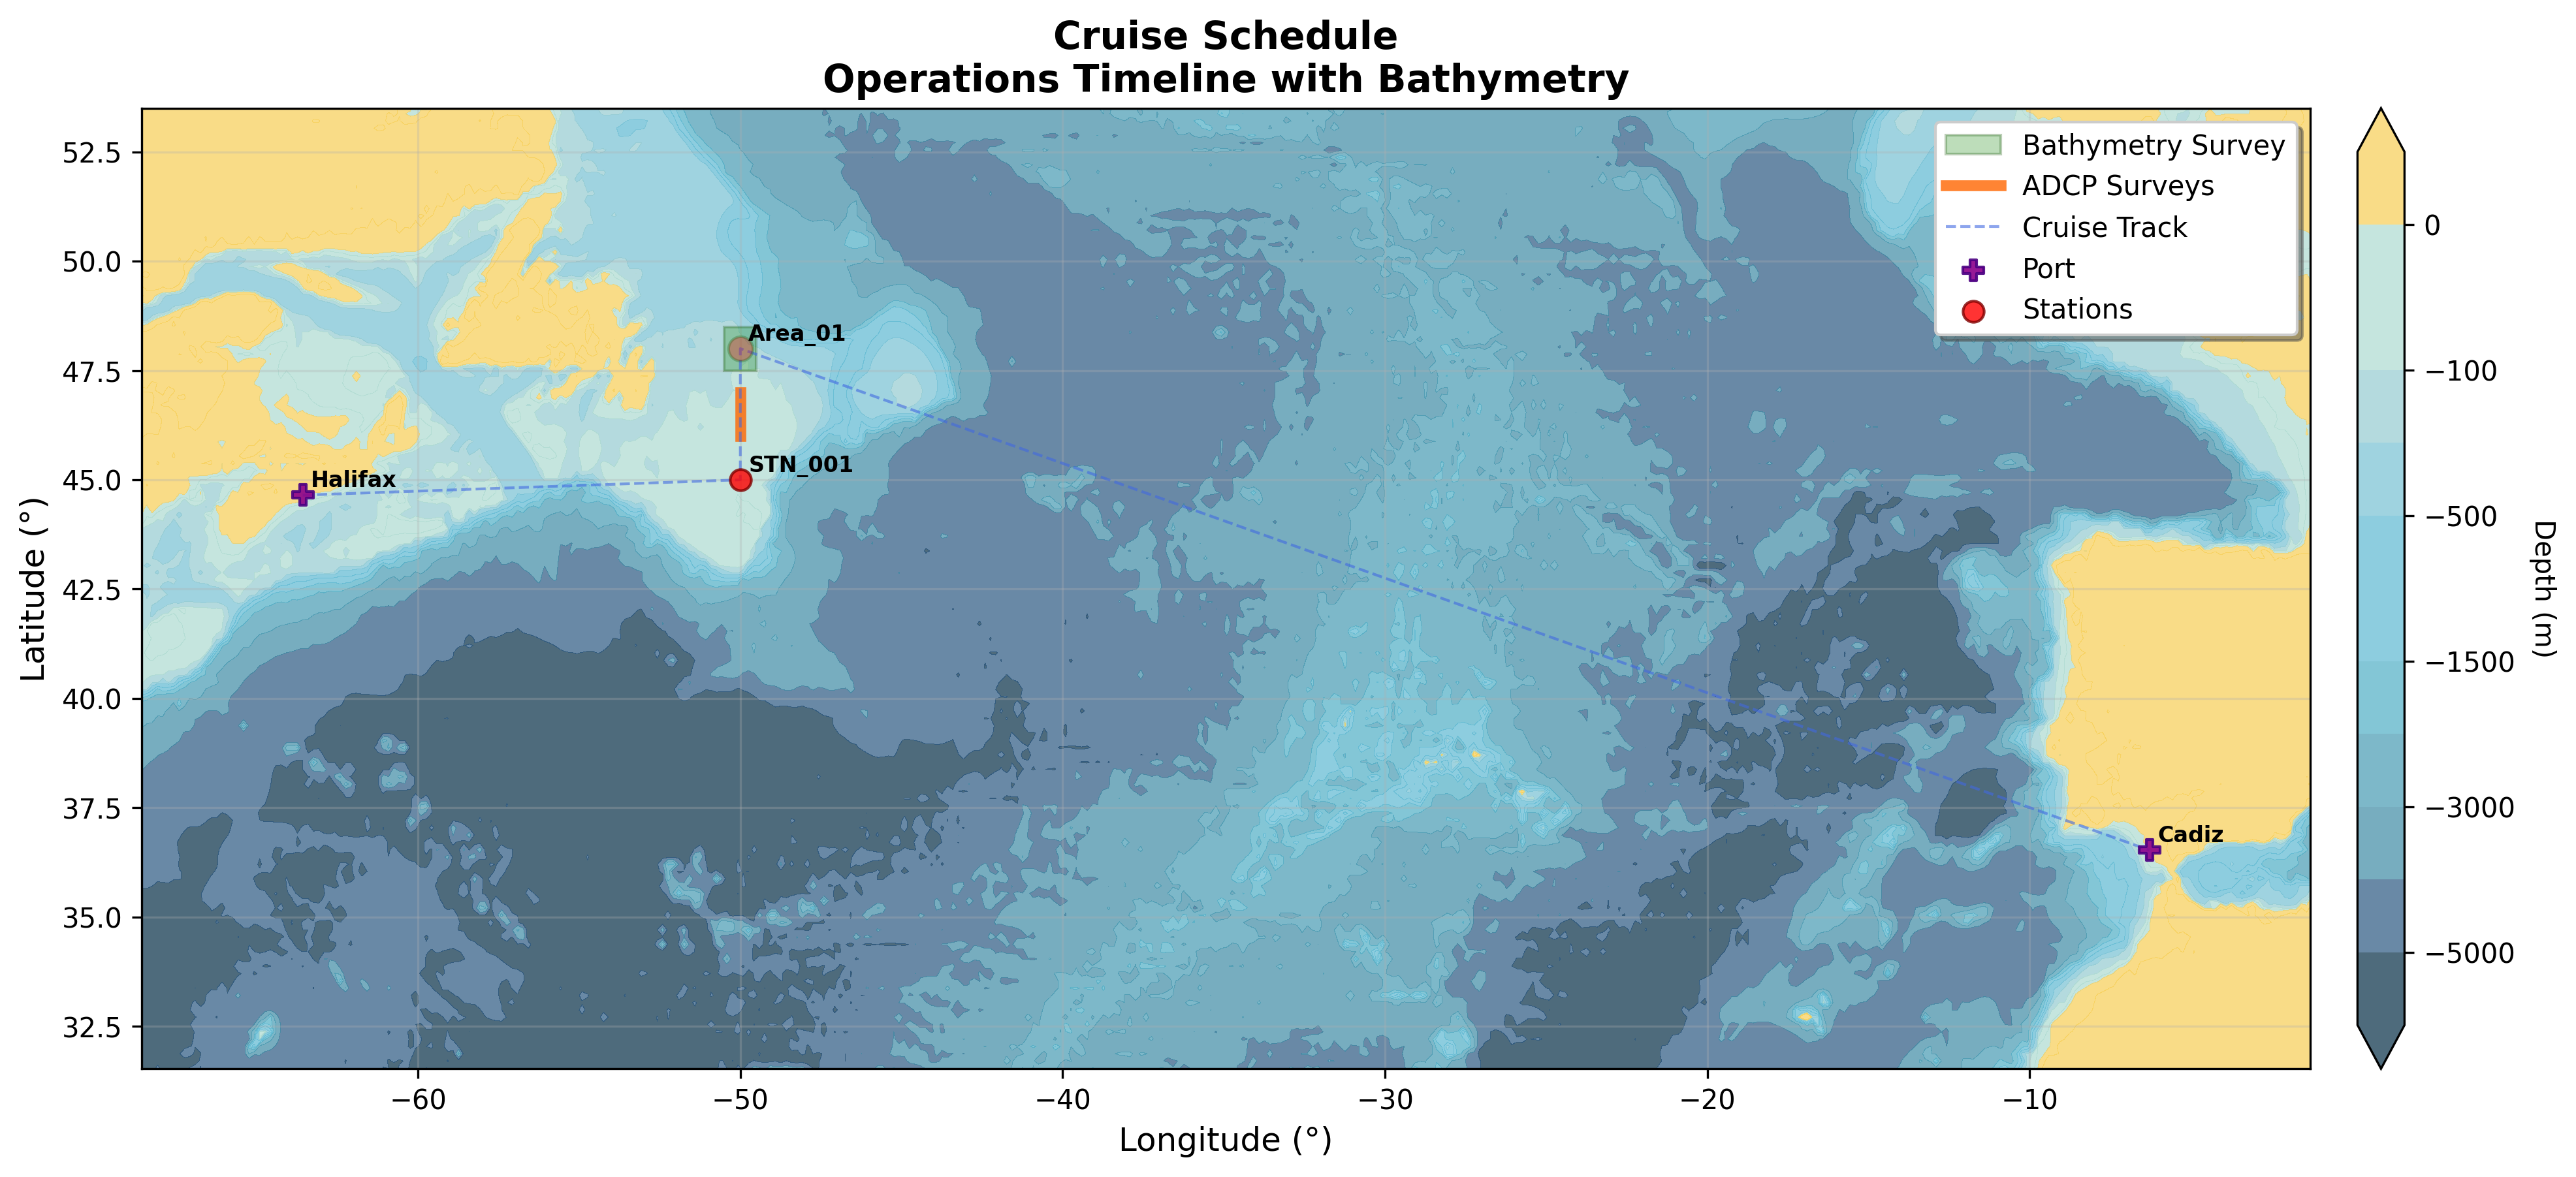
Figure 1: Cruise track map showing station locations, bathymetric context, and planned route.
| Activity | Description | Hours | Days |
|---|---|---|---|
| CTD Profiles | 1 stations, avg depth 58 m, avg 0.5 hrs each | 0.5 | 0.0 |
| Survey operations | 1 operations, avg distance 60.0 nm, avg 12.0 hrs each | 12.0 | 0.5 |
| Area operations | 1 operations, avg 2.0 hrs each | 2.0 | 0.1 |
| Transit within area | 96.3 nm, avg 10.0 kts | 9.6 | 0.4 |
| Transit to/from working area | 2585.1 nm, avg 10.0 kts | 258.5 | 10.8 |
| Total Cruise | 3 operations | 282.7 | 11.8 |
| Name | Comment | Position (Decimal) | Position (DD MM.mmm) | Depth (m) | Duration (hrs) | Action |
|---|---|---|---|---|---|---|
| No moorings defined | ||||||
Individual leg schedules including transit connections between legs.
| Activity | Type | Entry Position | Exit Position | Distance (nm) | Duration (hrs) | Comments |
|---|---|---|---|---|---|---|
| Halifax | Port mob | 44.6488, -63.5752 | 44.6488, -63.5752 | - | 0.0 | |
| Transit to STN_001 | Transit | 44.6488, -63.5752 | 45.0000, -50.0000 | 577.8 | 57.8 | |
| STN_001 | CTD profile | 45.0000, -50.0000 | 45.0000, -50.0000 | - | 0.5 | |
| Transit to ADCP_Survey | Transit | 45.0000, -50.0000 | 46.0000, -50.0000 | 60.0 | 6.0 | |
| ADCP_Survey | Underway ADCP | 46.0000, -50.0000 | 47.0000, -50.0000 | 60.0 | 12.0 | |
| Transit to Area_01 | Transit | 47.0000, -50.0000 | 47.5000, -50.5000 | 36.3 | 3.6 | |
| Area_01 | Survey bathymetry | 47.5000, -50.5000 | 47.5000, -49.5000 | - | 2.0 | |
| Transit to Cadiz | Transit | 47.5000, -49.5000 | 36.5298, -6.2923 | 2007.3 | 200.7 | |
| Cadiz | Port demob | 36.5298, -6.2923 | 36.5298, -6.2923 | - | 0.0 | |
| Leg Total | 2 operations | 282.7 | 11.8 days |
Figure 1: Cruise track map showing station locations, bathymetric context, and planned route.