A1 Lecture Notes: Timescales#
Key Takeaways for A1#
What you should understand after this lecture:
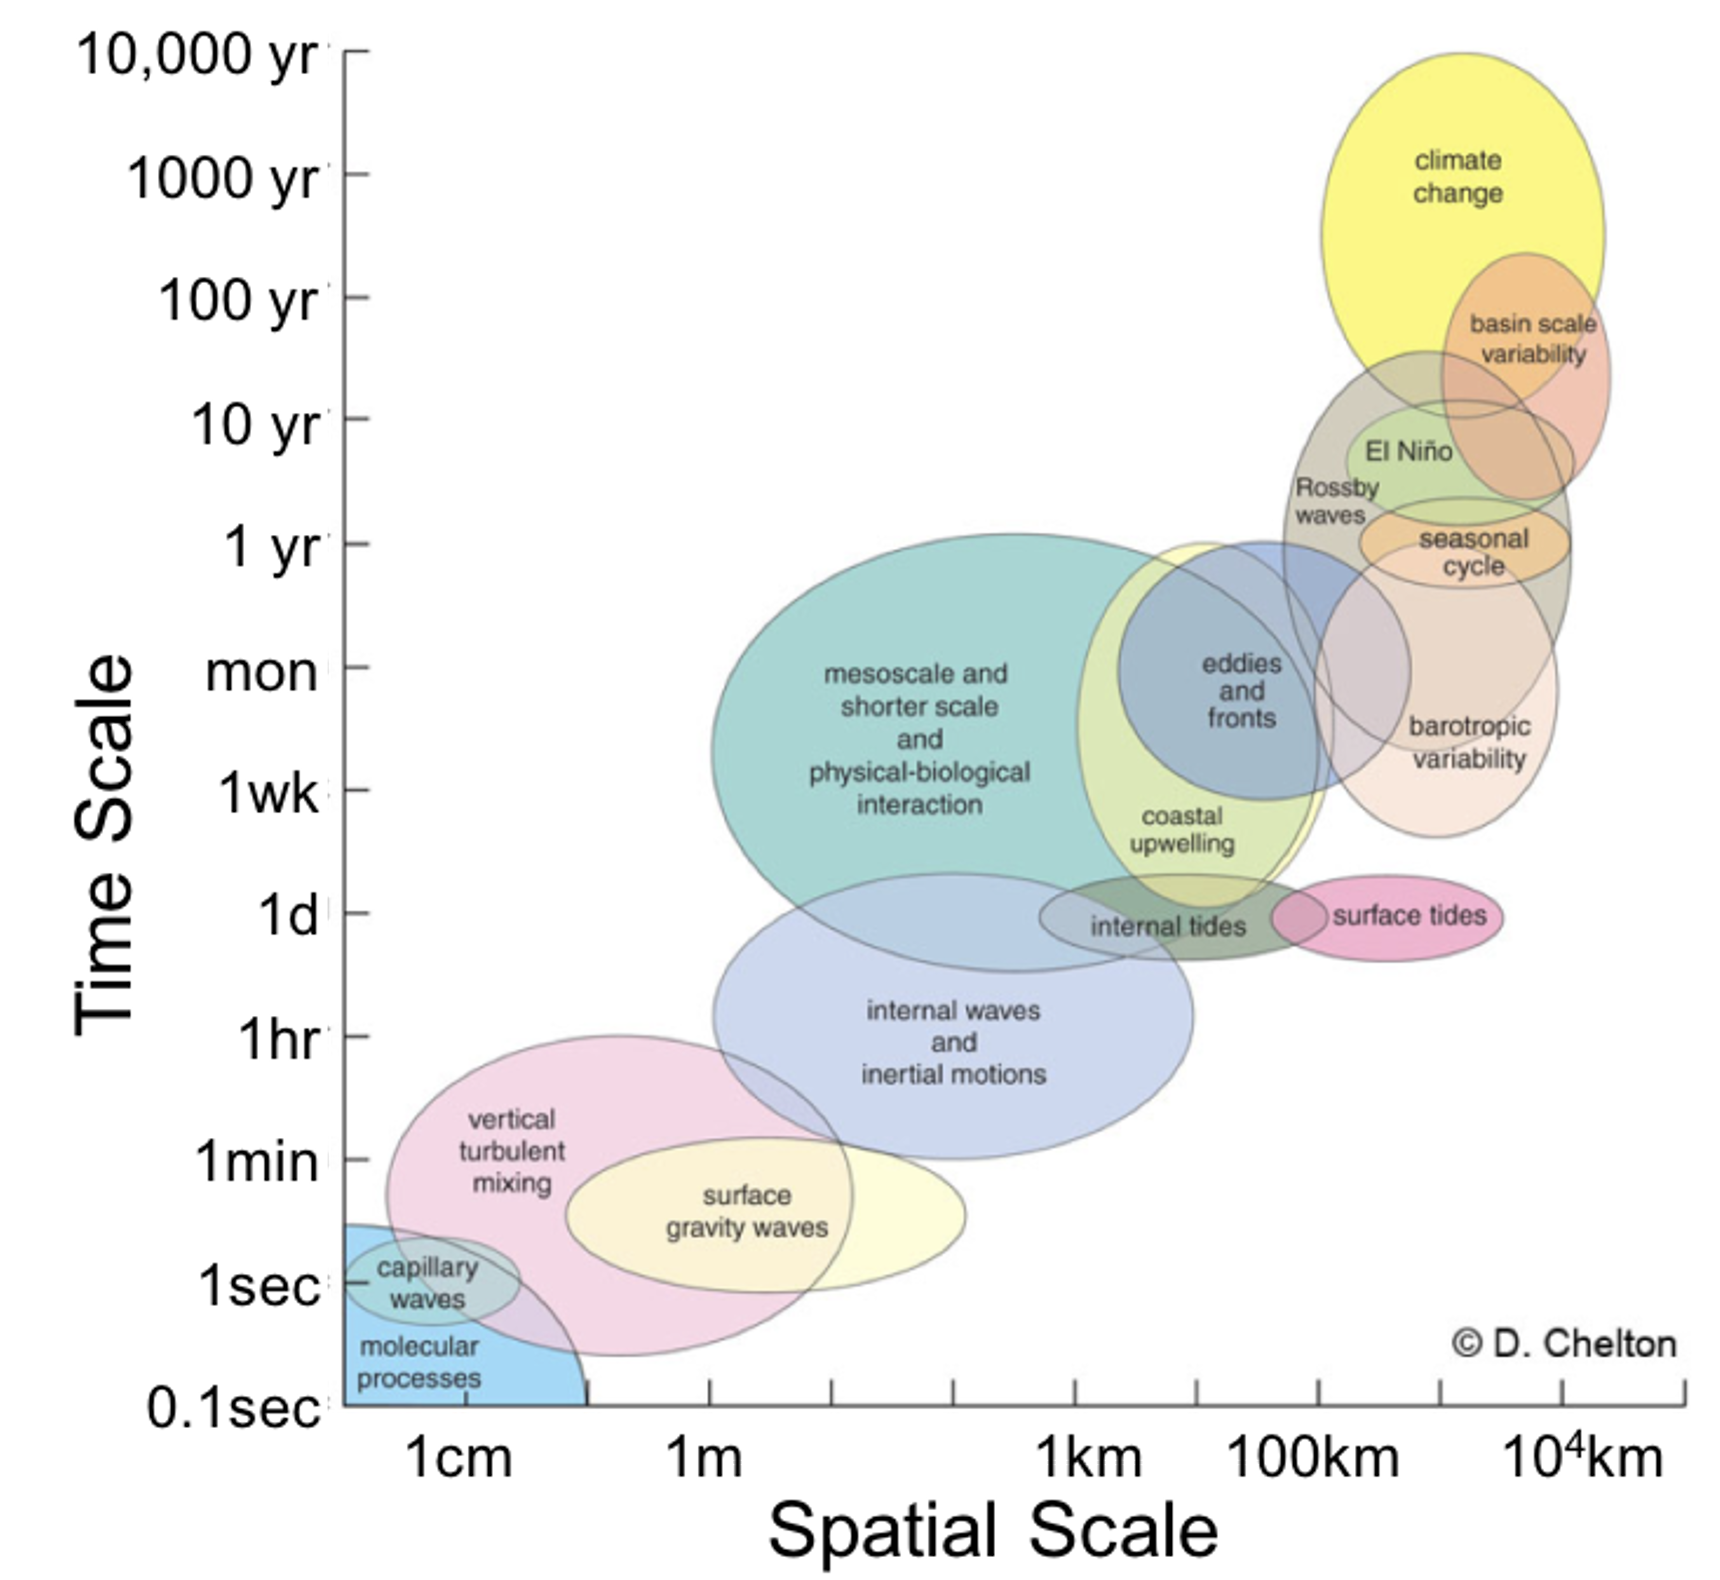
Scale Determines Strategy: Ocean processes span 10+ orders of magnitude in space and time. You cannot measure everything everywhere. Your measurement strategy must match your target process scale. Use the Stommel/Chelton diagram as your guide.
Technology Enables Discovery: We discover what we can measure. Before satellites: (almost) no mesoscale eddies (we thought the ocean was boring away from coasts). Before Argo: limited subsurface data. Before ADCP: crude current measurements. New technology = new understanding.
Sampling Matters: How you sample determines what you see. Sample too infrequently (aliasing) and you misinterpret the ocean. Sample too coarsely in space and you miss important processes. Design matters.
Evolution Toward Sustained Observing: Oceanography evolved from heroic expeditions (HMS Challenger) → coordinated experiments (WOCE) → sustained global monitoring (Argo, satellites). Modern oceanography is continuous, international, and autonomous. Climate studies require this sustained approach.
Integration is Key: No single platform does everything. Ships give high resolution in space/time but limited coverage. Satellites give global surface coverage but can’t see subsurface. Moorings give time series but are fixed in space. Floats give global subsurface coverage but drift. Modern oceanography combines multiple platforms - multiplatform approach.
Connection to Rest of Course#
A1 sets up everything that follows:
Understanding how A1 connects to the rest of the course helps you see the bigger picture:
A2 (Platforms): Now we dive deeper into each platform type - ships, moorings, gliders, floats, satellites - with their specific capabilities and limitations
A3 (Hydrography): The CTD is what goes on these platforms - now we learn how the sensors actually work and why calibration matters
A4 (Currents): Velocity adds another dimension - Eulerian (mooring ADCP) vs Lagrangian (drifters, floats)
A5 (Data & Errors): All these measurements have errors, gaps, biases - how do we deal with them?
Think of it this way:
A1 is the “why and what” - What scales matter and why do we measure?
A2 is the “where and when” - What platforms can measure where and when?
A3-A4 are the “how we measure” - How do the sensors and instruments work?
A5 is the “how good are the measurements” - What are the limitations and uncertainties?
Everything connects back to the Stommel diagram: Every measurement choice in A2-A5 comes back to the fundamental question from A1: “What scale am I trying to observe?”
Evolution of Ocean Observing Systems#
Understanding how ocean observation has evolved helps you appreciate the scale challenges in oceanography and how modern technology addresses the space-time sampling problem.
WOCE (World Ocean Circulation Experiment, ~1990-2002)#
Scale of the effort:
98 research vessels from 30 nations
Systematic global coverage with standardized measurements
High-quality hydrographic sections repeated over time
What made it special:
First truly global, coordinated oceanographic effort
Established standardized measurement protocols
Created climate-quality baseline datasets
Modern continuation:
Now coordinated by GO-SHIP (Global Ocean Ship-based Hydrographic Investigations Program)
Historical data available at WOCE Atlas
Why WOCE matters: Established the foundation for climate-quality oceanographic measurements and demonstrated the power of international cooperation and standardized methods.
Argo Program (2000-present)#
The numbers:
Started in 1998, now ~4000 active floats globally
Profile every 10 days from 2000m to surface
Target: Resolve 3° latitude × 3° longitude grid box on 3-monthly timescale
Extensions: Deep Argo (6000m), BGC Argo (biogeochemistry)
How it works:
International program with satellite communication
Real-time public data access
Fully automated measurements
Key resources:
Argo Program - Main program site
Fleet Monitoring - Track active floats in real-time
Revolutionary impact: Transformed oceanography from ship-based snapshots to continuous global monitoring. Critical for climate studies including ocean heat content and salinity changes.
Connecting the Scales#
Ship-based observations (WOCE/GO-SHIP):
High spatial resolution along sections
Full-depth, high-quality measurements
Limited temporal coverage (repeat sections every ~10 years)
Float-based observations (Argo):
Global spatial coverage
Continuous temporal coverage (every 10 days)
Standard depth range (2000m to surface, expanding to 6000m)
The breakthrough: Argo solved the space-time sampling problem that limited ship-based oceanography. Instead of occasional snapshots, we now have continuous global monitoring.
Looking Forward: Modern Technology#
What you’ll encounter:
When we discuss sensor accuracy in A3, remember that Argo floats use the same CTD technology (SBE-41 sensors) but the calibration is (mostly) devoid of ships
Your Seepraktikum measurements use similar principles to these global programs, just at different scales
Bottom line: Modern oceanography combines the spatial detail of ship-based surveys with the temporal continuity of autonomous platforms. Understanding these scales helps you choose the right approach for your research questions.