KML Output
KML format provides geographic visualization compatible with Google Earth, Google Maps, and other geographic information systems. The output focuses on positional data for the scientific operations.
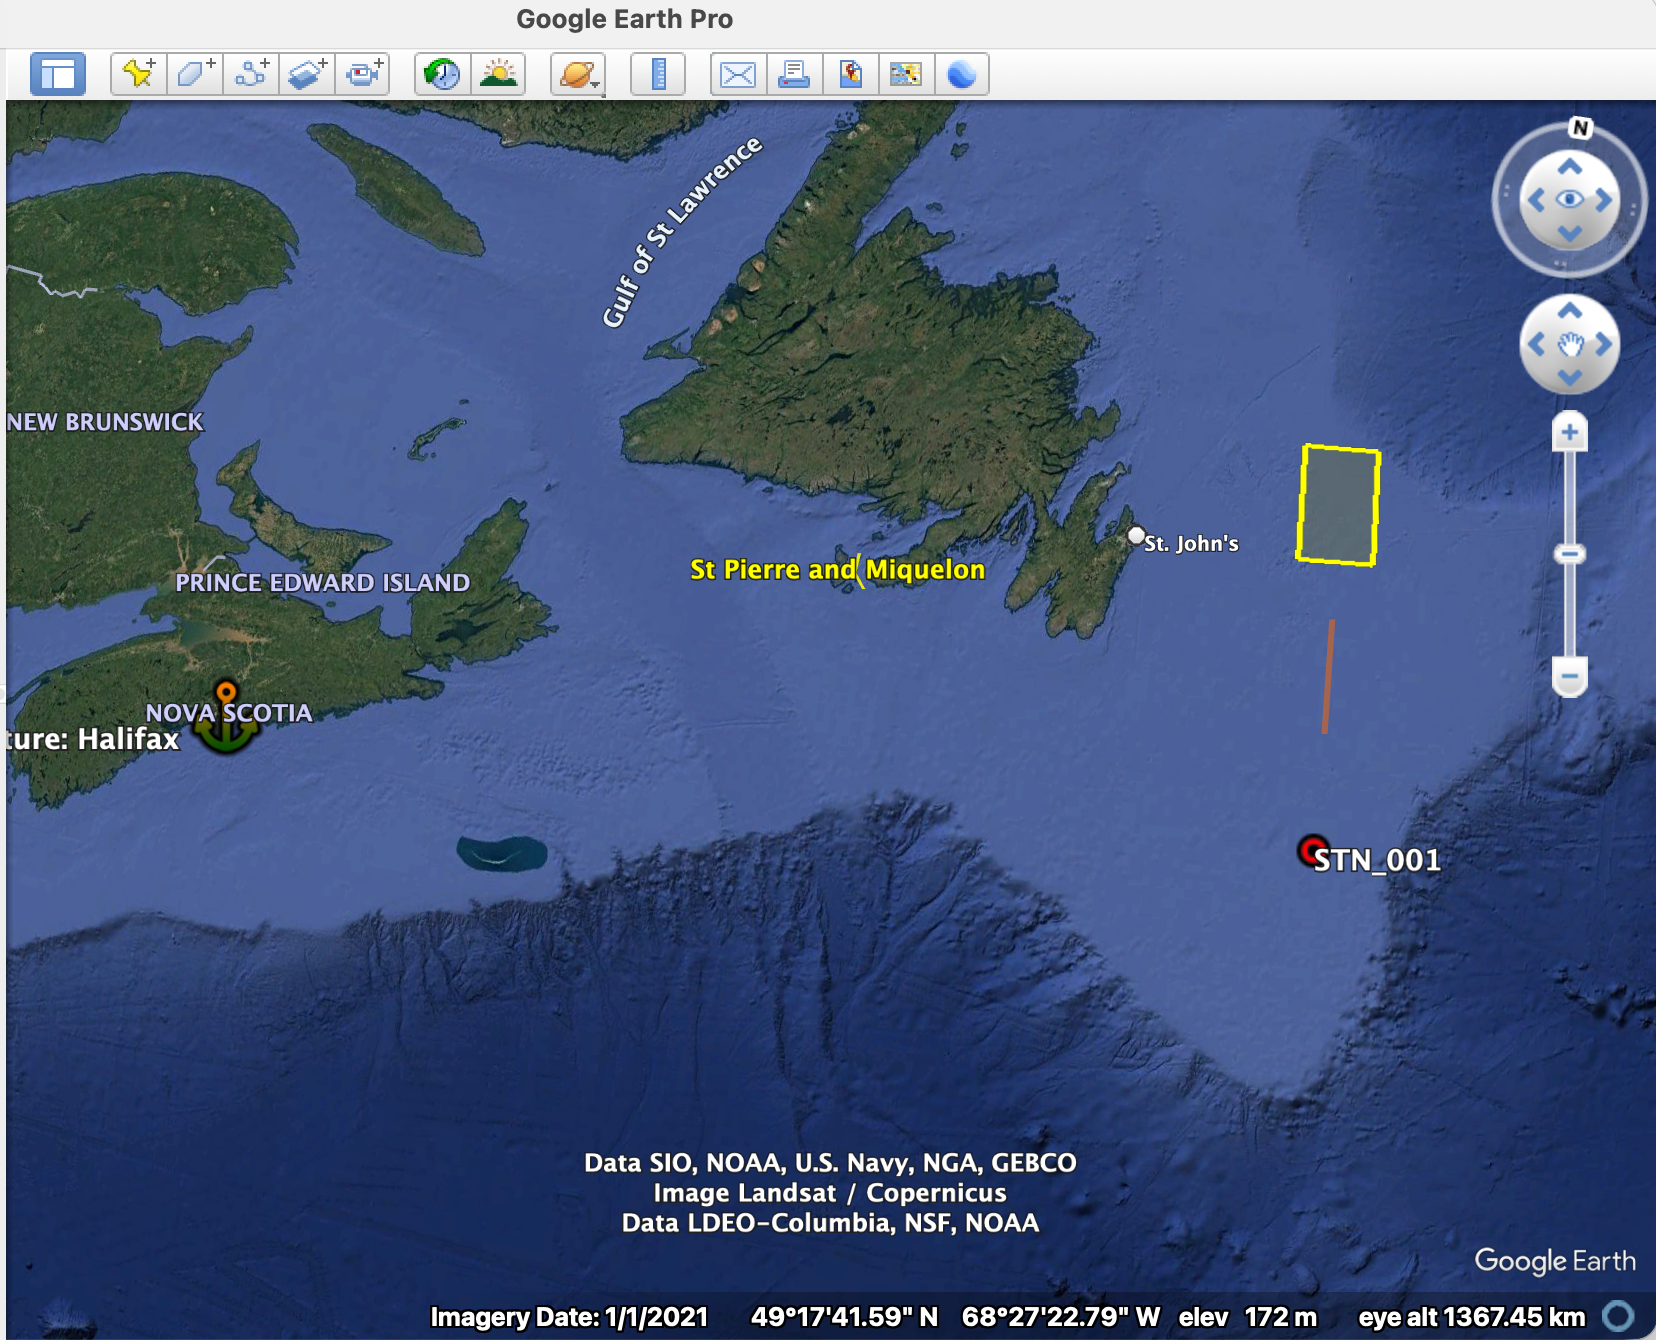
KML output from tc4_mixed_ops.yaml displayed in Google Earth, demonstrating the geographic visualization with color-coded station markers, transit routes, survey areas, and 3D bathymetric context suitable for expedition planning and public outreach.
Note
KML output is available from the map command (cruiseplan map --format kml), and does not include any information from the scheduling.
Purpose and Use Cases
- Primary Uses:
Google Earth visualization and exploration
Geographic information system (GIS) integration
KML Structure and Features
Generated KML files contain configuration-based geographic data in a flat structure with individual placemarks:
- Configuration Elements Included:
Port Points: Departure and arrival ports with basic location information
Station Points: Individual CTD, mooring, and other operation locations
Scientific Transit Lines: Underway operations (e.g., ADCP surveys) with start/end coordinates
Area Polygons: Survey areas defined by corner coordinates
- What is NOT Included:
No cruise track connections between stations/ports
No timeline or scheduling information
No hierarchical folder organization
No detailed operation metadata or scientific objectives
No time stamps or temporal data
Note
The KML output represents the configuration catalog only, not the scheduled timeline. It shows where operations are planned, but not when they occur or how the vessel routes between them.
Geographic Visualization
Markers and Styling
Operation Type Styling:
Element Type |
Style |
Description |
|---|---|---|
Stations |
Red circle markers |
CTD and other point operations |
Ports |
Orange marina icons |
Departure and arrival points |
Scientific Transits |
Red lines |
ADCP surveys and underway operations |
Areas |
Cyan polygons |
Survey areas with semi-transparent fill |
- Information Content:
Basic text descriptions:
<!-- Station example -->
Type: Station (OperationTypeEnum.CTD)
Action: ActionEnum.PROFILE
Location: 45.000000°N, -50.000000°W
Depth: N/A m

<!-- Port example -->
Port: Halifax
Type: Departure Port
Location: 44.648800°N, -63.575200°W
Timezone: America/Halifax

<!-- Transit example -->
Type: Transit
Start: 46.000000°N, -50.000000°W
End: 47.000000°N, -50.000000°W
Distance: calculated nm

<!-- Area example -->
Type: Area
Corners: 4
Operation: AreaOperationTypeEnum.SURVEY
Transits and Areas (Lines and Polygons)
- Scientific Transit Lines:
Only underway scientific operations (e.g., ADCP surveys) are shown as lines
Red lines connecting start and end coordinates of scientific transit operations
Cruise track connections between stations are not shown
- Area Polygons:
Survey areas shown as closed yellow polygons
Defined by corner coordinates from configuration
Semi-transparent fill to show underlying map features
Future Enhancements
Current Limitations
- Missing Features:
Basic popup content without HTML formatting
No scientific objectives or detailed metadata
- Timing information:
No time stamps or temporal data (no Google Earth time slider support)
No cruise track connections between operations
No scheduling or timeline information
This would only be possible if we generated the KML from the schedule data rather than the YAML configuration (which is what “cruiseplan map” currently does).
- Planned Enhancements (see todos):
Rich HTML popup content with operation details, timing and distance (where applicable)
Cruise track plotting based on schedule
Time-based KML with Google Earth animation support (if using schedule data)
Actual KML Structure Example
Simple Flat Structure
Based on the actual generated file:
<?xml version="1.0" encoding="UTF-8"?>
<kml xmlns="http://www.opengis.net/kml/2.2">
  <Document>
    <name>TC4_Mixed_Test - Catalog</name>
    <description>Cruise configuration catalog including all stations, moorings, transits, ports, and areas</description>

    <!-- Style definitions -->
    <Style id="stationStyle">
      <IconStyle>
        <color>ff0000ff</color>
        <scale>1.2</scale>
        <Icon>
          <href>http://maps.google.com/mapfiles/kml/shapes/placemark_circle.png</href>
        </Icon>
      </IconStyle>
    </Style>

    <!-- Port placemark -->
    <Placemark>
      <name>Departure: Halifax</name>
      <description>
        Port: Halifax
        Type: Departure Port
        Location: 44.648800°N, -63.575200°W
        Timezone: America/Halifax
      </description>
      <styleUrl>#portStyle</styleUrl>
      <Point>
        <coordinates>-63.5752,44.6488,0</coordinates>
      </Point>
    </Placemark>

    <!-- Station placemark -->
    <Placemark>
      <name>STN_001</name>
      <description>
        Type: Station (OperationTypeEnum.CTD)
        Action: ActionEnum.PROFILE
        Location: 45.000000°N, -50.000000°W
        Depth: N/A m
      </description>
      <styleUrl>#stationStyle</styleUrl>
      <Point>
        <coordinates>-50.0,45.0,0</coordinates>
      </Point>
    </Placemark>

    <!-- Scientific transit line -->
    <Placemark>
      <name>ADCP_Survey</name>
      <description>
        Type: Transit
        Start: 46.000000°N, -50.000000°W
        End: 47.000000°N, -50.000000°W
        Distance: calculated nm
      </description>
      <styleUrl>#transitStyle</styleUrl>
      <LineString>
        <coordinates>
          -50.0,46.0,0
          -50.0,47.0,0
        </coordinates>
      </LineString>
    </Placemark>

    <!-- Area polygon -->
    <Placemark>
      <name>Area_01</name>
      <description>
        Type: Area
        Corners: 4
        Operation: AreaOperationTypeEnum.SURVEY
      </description>
      <styleUrl>#areaStyle</styleUrl>
      <Polygon>
        <outerBoundaryIs>
          <LinearRing>
            <coordinates>-50.5,47.5,0 -50.5,48.5,0 -49.5,48.5,0 -49.5,47.5,0 -50.5,47.5,0</coordinates>
          </LinearRing>
        </outerBoundaryIs>
      </Polygon>
    </Placemark>

  </Document>
</kml>
Style Definitions
Marker Styles:
<Style id="ctd_station">
  <IconStyle>
    <Icon>
      <href>http://maps.google.com/mapfiles/kml/shapes/sailing.png</href>
    </Icon>
    <scale>1.2</scale>
    <color>ff0000ff</color>
  </IconStyle>
  <LabelStyle>
    <scale>0.8</scale>
    <color>ff000000</color>
  </LabelStyle>
</Style>
Line Styles:
<Style id="cruise_track">
  <LineStyle>
    <color>ff0000ff</color>
    <width>3</width>
  </LineStyle>
</Style>
Integration Applications
Google Earth Integration
- Viewing Features:
3D terrain visualization with bathymetric context
Layer control for selective data display
Measurement tools for distance and area calculations
GIS System Import
- Compatible Software:
QGIS for advanced spatial analysis
ArcGIS for professional cartography
Marine navigation systems (ECDIS)
The KML output format provides versatile geographic visualization capabilities that serve diverse audiences. It also allows integration with other *.kml based datasets.