PNG Output
PNG format provides static map visualizations for cruise planning, documentation, and presentation. CruisePlan generates PNG maps in two ways, depending on whether you just want operational locations (cruiseplan map) or also scheduling/transit information (cruiseplan schedule) to be plotted.
Purpose and Use Cases
- Primary Uses:
Proposal and funding application documentation
Cruise plan visualization and review
Scientific presentation and publication figures
Field operation reference maps
Command Comparison: Schedule vs Map
CruisePlan generates PNG maps through two commands with distinct characteristics:
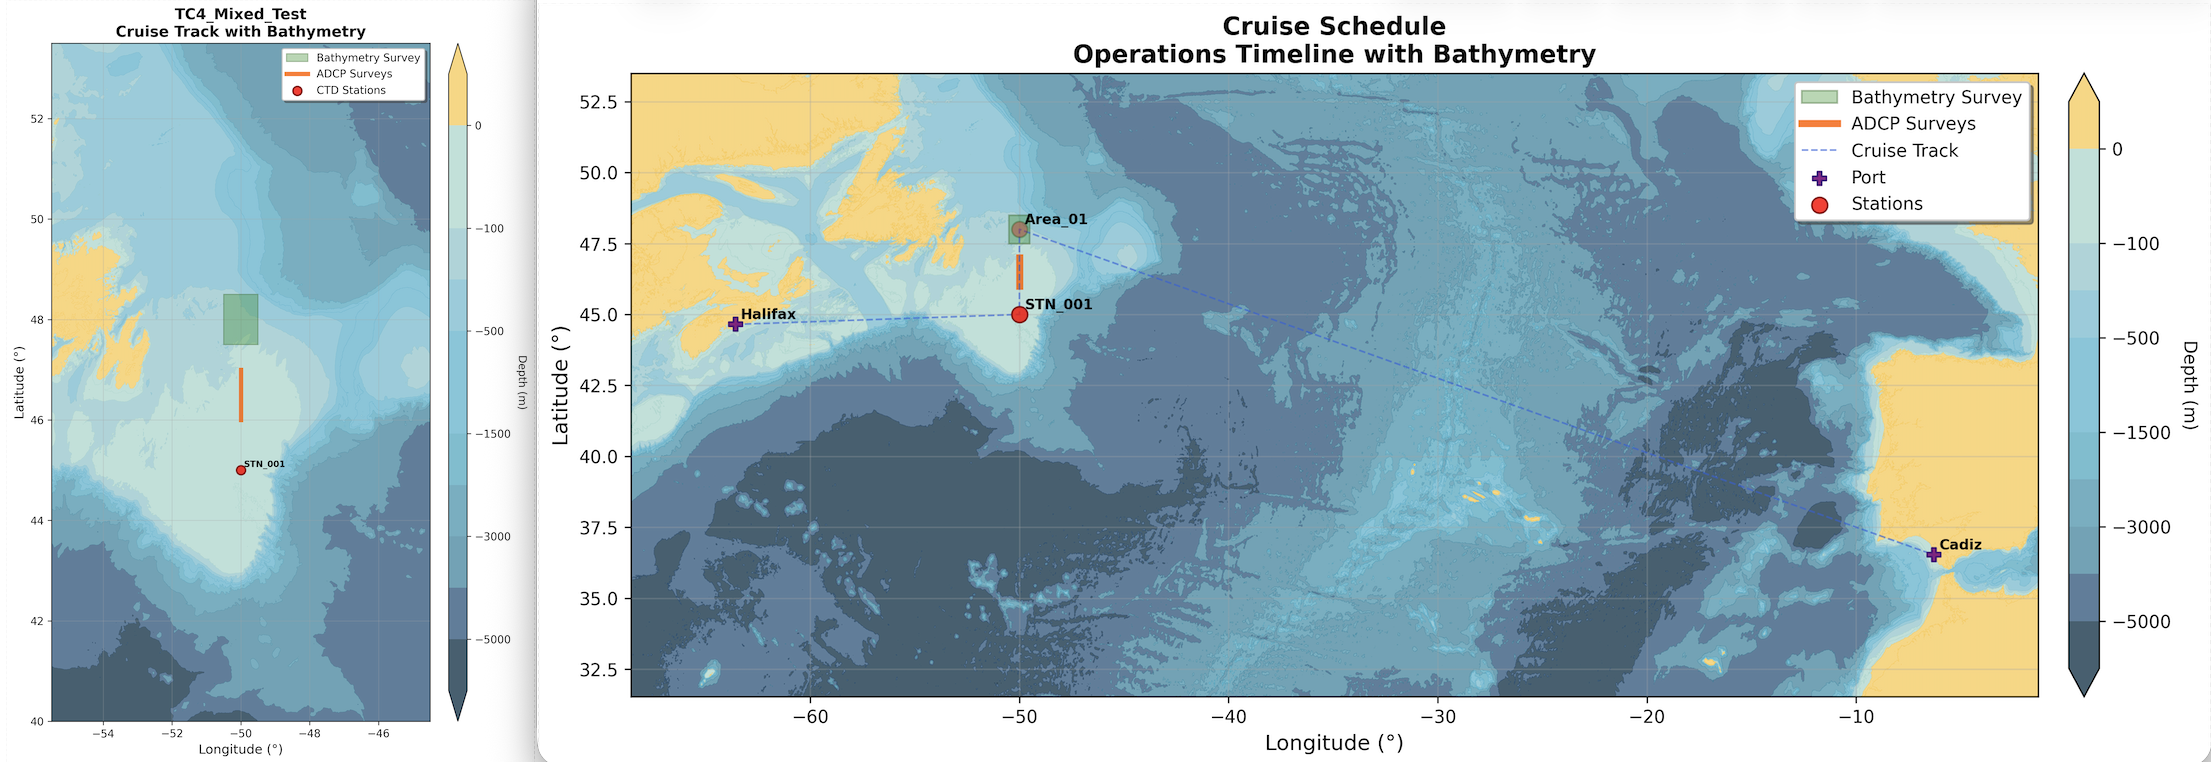
PNG Output Comparison: Left shows cruiseplan map output (configuration-based), right shows cruiseplan schedule output (timeline-based). Note the key difference: schedule output includes departure/arrival ports and lines to show transits, while map output focuses purely on station configuration.
Feature |
Schedule PNG ( |
Map PNG ( |
|---|---|---|
Data Source |
Generated timeline with scheduling |
YAML configuration only |
Port Visualization |
✅ Shows departure and arrival ports |
❌ Ports not displayed |
Station Order |
Scheduled sequence (leg-based execution order) |
Configuration order (definition sequence) |
Cruise Track Lines |
Complete executed route between all operations |
Basic station connections only |
Station Visualization |
Uniform markers (operation type from timeline) |
Differentiated markers (stations vs moorings) |
Use Case |
Schedule and execution planning |
Proposals (port independent) and overview |
Prerequisites |
Requires successful validation and scheduling |
Works directly with YAML configuration |
Performance |
Slower (includes scheduling calculations) |
Faster (direct from configuration) |
Schedule PNG Output (Timeline-Based)
Generated via: cruiseplan schedule -c cruise.yaml --format png
Characteristics:
Shows operations in scheduled execution order
Includes complete cruise track with all transits
Requires prior validation and scheduling success
Example Command Usage:
# Basic schedule PNG generation
cruiseplan schedule -c cruise.yaml --format png

# High-resolution output with custom bathymetry
cruiseplan schedule -c cruise.yaml --format png --bathy-source gebco2025

# Combined outputs for complete documentation
cruiseplan schedule -c cruise.yaml --format png,html,latex
Output File: {cruise_name}_schedule.png
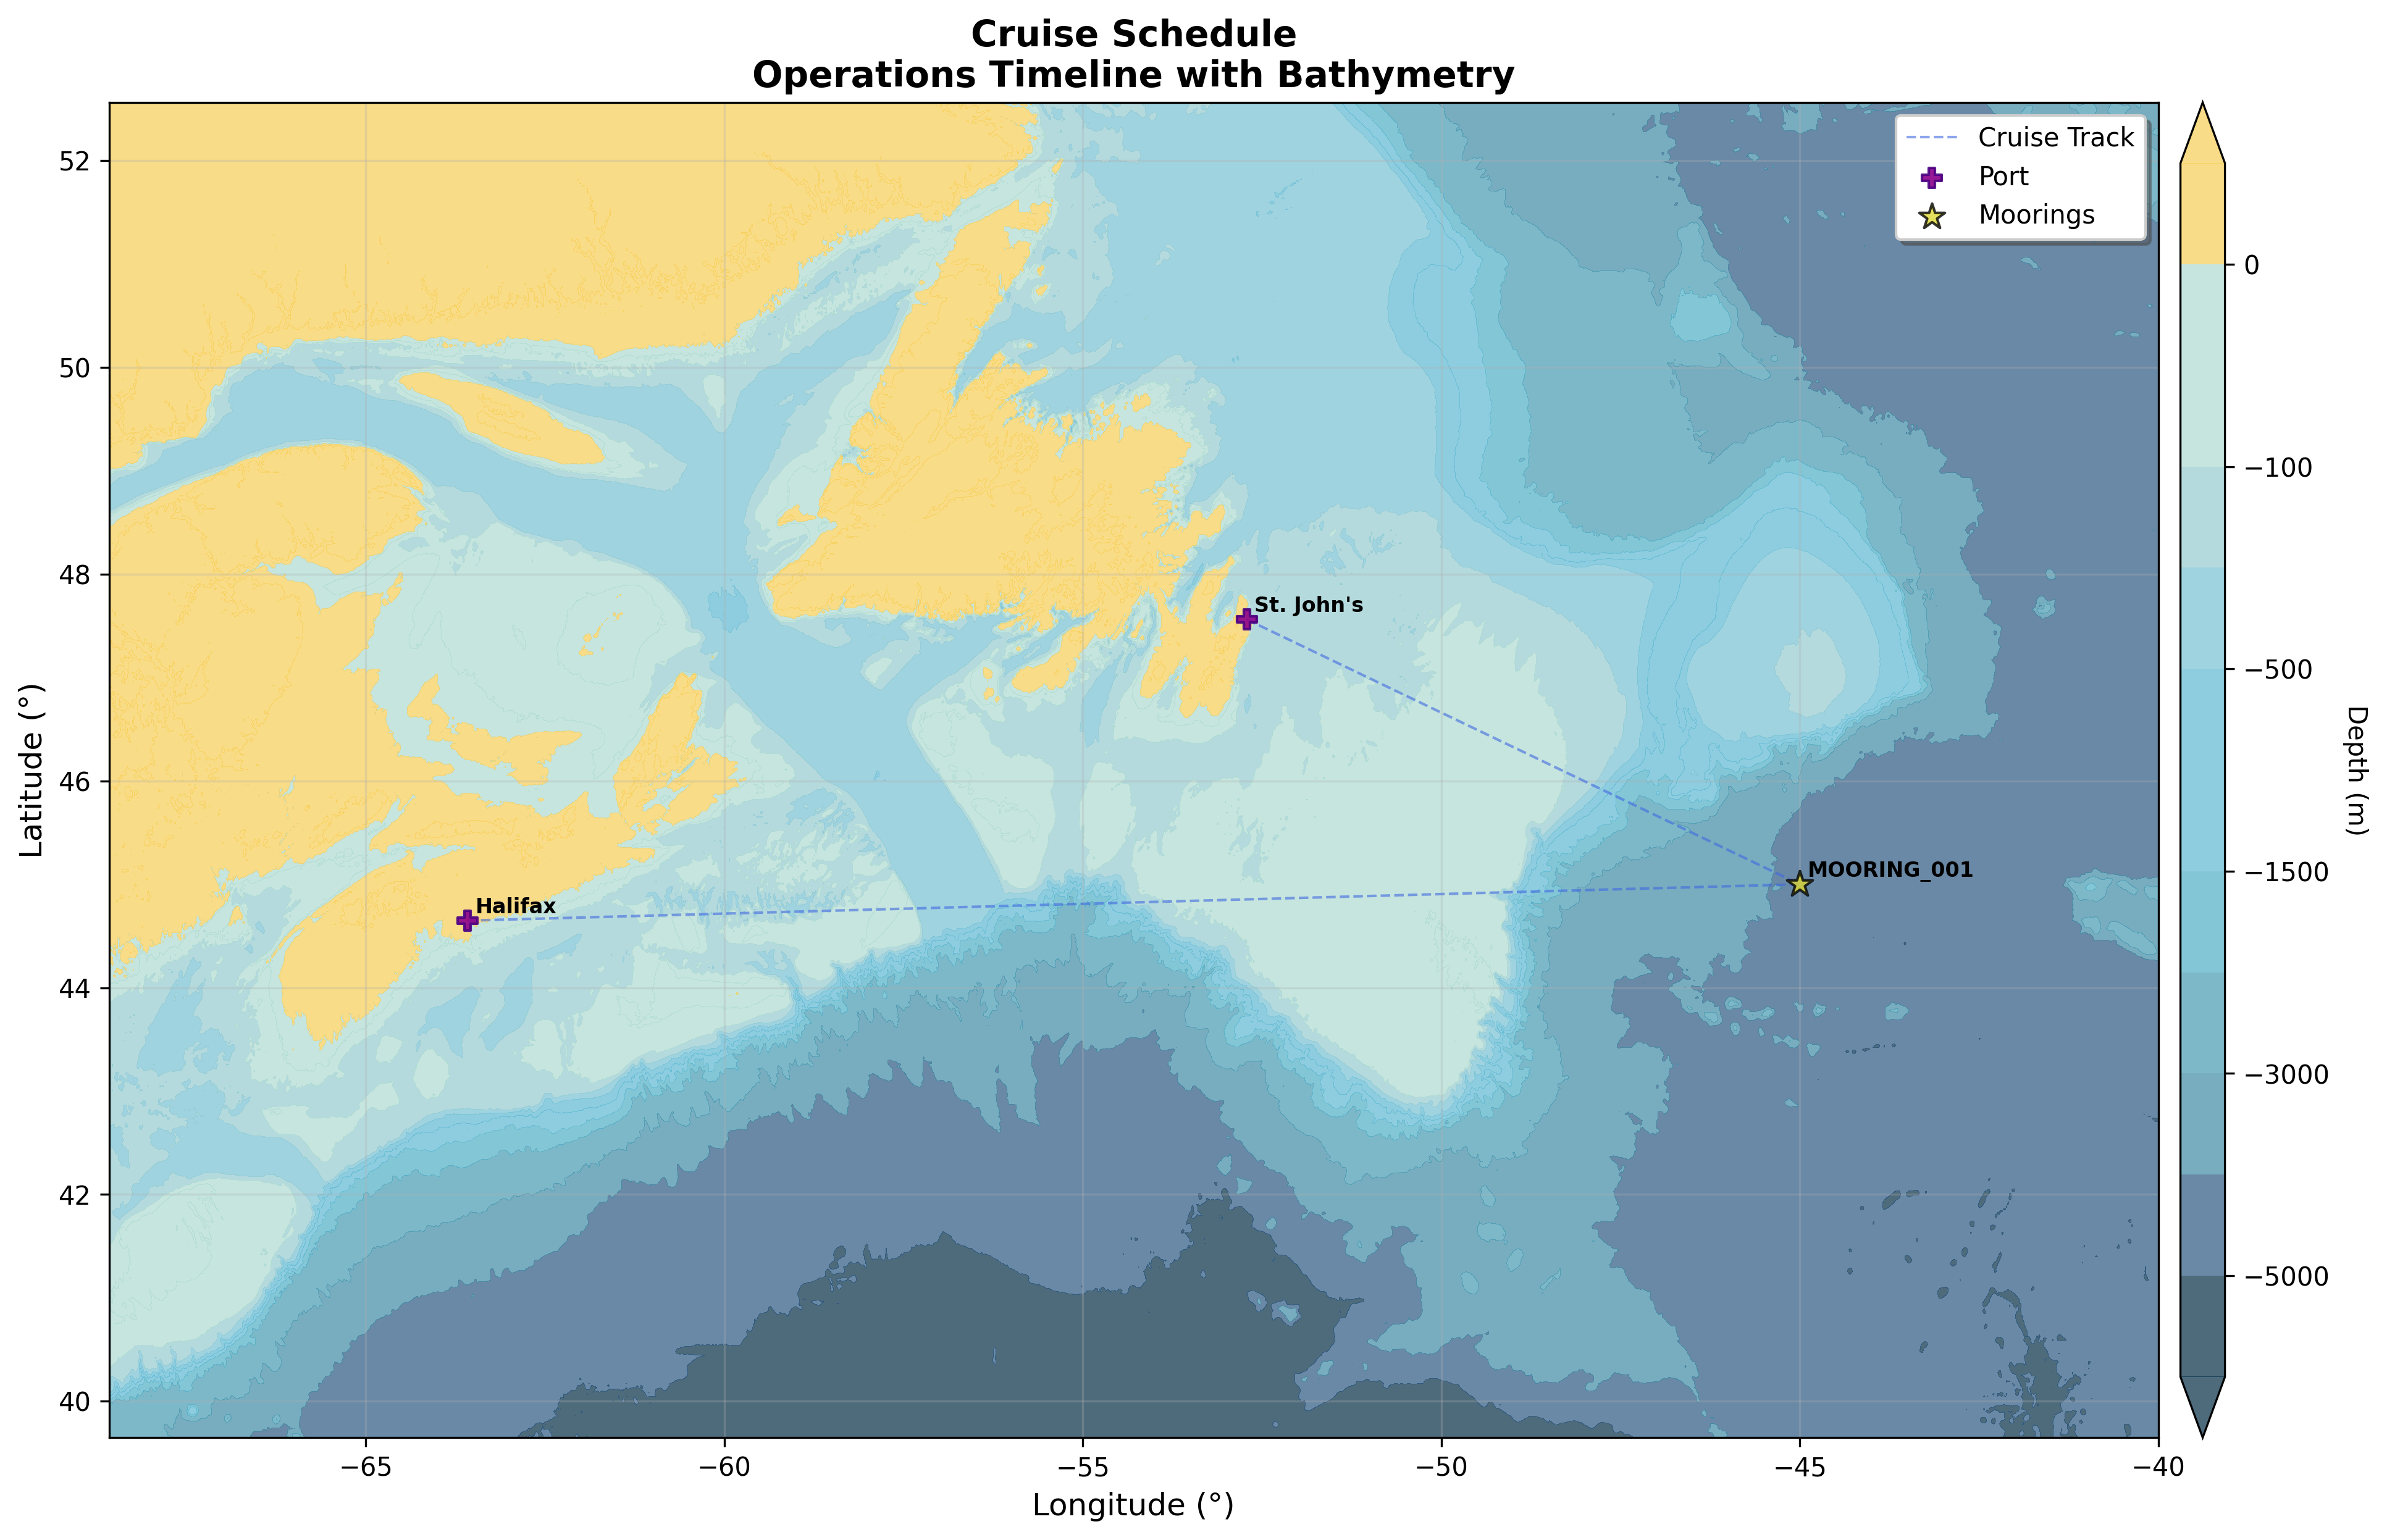
Shows a cruise track with a single operation (mooring) and two ports.
Map PNG Output (Configuration-Based)
Generated via: cruiseplan map -c cruise.yaml --format png
Characteristics:
Shows stations in YAML configuration order
Displays differentiated station types (stations vs moorings)
Works with any valid YAML configuration
Example Command Usage:
# Basic configuration map
cruiseplan map -c cruise.yaml --format png

# Custom figure size and bathymetry
cruiseplan map -c cruise.yaml --figsize 14 10 --bathy-source etopo2022

# Specific output file and directory
cruiseplan map -c cruise.yaml --output-dir maps/ --output planning_map

# Interactive preview before saving
cruiseplan map -c cruise.yaml --show-plot
Output File: {cruise_name}_map.png

Shows the station naming for a section which has been expanded by cruiseplan enrich.
Integration and workflows
Both PNG outputs include bathymetric background visualization. For cruiseplan map, the bathymetry source can be selected, while for cruiseplan schedule, GEBCO 2025 is always used.
- Bathymetry Sources:
GEBCO 2025: High-resolution global bathymetry (default)
ETOPO 2022: Lower-resolution for faster generation
- Contour Styling:
Depth contours at standard oceanographic intervals
Color-coded depth ranges from land (yellow) and water (blues) ranging from shallow (light) to deep (dark)
Configuration Options for cruiseplan map only:
# High-detail bathymetry (slower generation)
--bathy-source gebco2025 --bathy-stride 1

# Fast bathymetry for quick previews
--bathy-source etopo2022 --bathy-stride 10
- Station Markers (Red Circles):
Labels with station names
- Mooring Markers (Gold Stars):
Distinctive star shape for easy identification
- Line Operations (orange lines):
Represent underway operations (e.g., ADCP surveys)
- Area Operations (when present):
Polygon outlines with semi-transparent fill
Center point routing anchors
These are not user-configurable unless you clone the repository and edit cruiseplan/utils/plot_config.py. See the file on GitHub: cruiseplan/utils/plot_config.py on GitHub.
Figure Size Options for cruiseplan map only:
# Standard size (default)
--figsize 12 10
Note that making the figure size smaller will increase the relative size of the fonts, so if you want fonts to be more legible, make the figure size smaller.
- Output Quality:
300 DPI resolution for publication quality (not configurable)
PNG for lossless compression and clarity
- Initial Planning Phase (use
cruiseplan map): Create initial YAML configuration
Generate configuration-based PNG for review
Iteratively refine station positions and operations
Share planning maps with collaborators
- Final Planning Phase or for cruise reports (use
cruiseplan schedule): Validate and enrich configuration
Generate timeline-based PNG
Review execution order and timing
Generate final documentation set
- Schedule PNG Files:
Format:
{cruise_name}_schedule_map.pngExample:
Arctic_Survey_2024_schedule_map.png
- Map PNG Files:
Format:
{cruise_name}_map.png(or custom via--output)Example:
Arctic_Survey_2024_map.png
Command Examples for Organization:
# Planning phase outputs
cruiseplan map -c cruise.yaml --output-dir planning/ --output initial_config

# Final schedule outputs
cruiseplan schedule -c cruise.yaml -o schedules/ --format all
Visual Quality Checks
- Review Checklist:
All stations visible and labeled
Bathymetric context appropriate for operation depths
Track lines connect logically between operations
Proper scaling and geographic projection
Common Issues and Solutions:
Issue |
Solution |
|---|---|
Overlapping station labels |
Use custom figure size: |
Unclear bathymetry |
Reduce stride: |
Slow generation |
Use ETOPO: |
Missing geographic context |
Check coordinate validity and map projection |
PNG output provides visualization capabilities for cruise planning, helping you to review the initial configuration and the routing. If you use and update the yaml during a cruise, then the final yaml can be used to generate the actual cruise track with the schedule command—useful for cruise reports.